iOS & Android Beats up Nintendo in the Gaming Market

iOS Androit Portable Game Market Nintendo

iOS & Android Beating up on Nintendo & Sony in Gaming

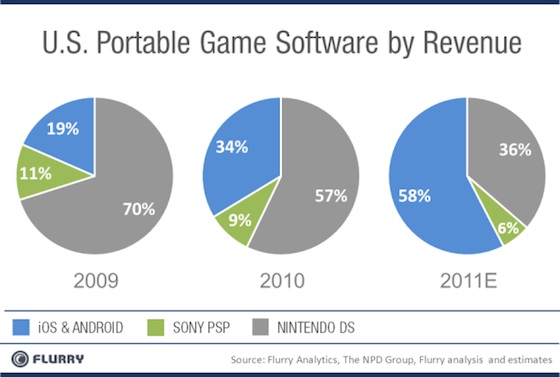
Flurry Analytics, a mobile analytics company, has come out with a report showing the shift in mobile gaming from traditional console providers such as Sony and Nintendo towards mobile systems such as iOS and Android.

iPhone Android iOS GamesiOS and Andriods leads the charge with a large bank of free and inexpensive games. Sony PSP, Nintendo DS, and any other potential portable gaming platform requires a consumer to spend over a $100 dollars for the gaming device alone then another $30-40 for each game. With the coming of the iPhone, the iTouch, and now multiple Android based smartphones, there is no longer a need to purchase a separate gaming device. Also many games can be had for free or for a mere dollar or two.

Nintendo DS no longer the Big Boy of Portable Gaming

In 2009, Nintendo DS accounted for 70% of all game software revenue. iOS & Android was at 19%. 2011 thus far estimated will see Nintendo drop to 36% while iOS and Android will eat up 58% of the gaming market revenue. This is out of a total portable game revenue pie of $3.3 billion dollars. The days of paying $40 a game seems to be numbered as many games are taking on freemium models where gamers get the game free and has the option to purchase more levels, features, or additional add-ons as they desire.

iOS Android iPhone
Let's Go Beat up Nintendo Together!

Nintendo will be facing it’s first fiscal year loss since it first started reporting profits in 1981. With both Apple and Google looking to enter into the TV space, it won’t be long before these games take over the living room as well.

  • Does any of this surprise you?
  • What is the last cartridge game you bought?
  • How many mobile games do you own?
Continue Reading

YouTube Statistics – Growing like a Man Child [Infographic]

YouTube Logo Big

YouTube Statistics – Growing like a Mad Child

By Paul Lee

YouTube is celebrating it’s sixth birthday and the statistics are in… It’s a Man Child.

(e.g. lebron james, greg oden, that 6 foot 200lb “12 yr old” pitcher at little league)

A mere two years ago, we wrote a post called YouTube Statistics – The Ultimate Time Suck. This article is currently the one of the most popular posts on Clean Cut Media. However it is amazing how quickly YouTube has grown. 90% of the YouTube Statistics you see out there are clearly outdated… thus here we’ve gathered some of the most current data, straight from YouTube and from articles dated in the last month. Enjoy!

YouTube History

  • Feb 2005 – Founders register domain name
  • July 2006 – 100M video views per day, 65,000 new video uploads per day
  • June 2007 – YouTube launches in 9 countries. Launches YouTube Mobile
  • Oct 2008 – 15 Hours of video uploaded every minute
  • Oct 2009 – YouTube announced more than 1 billion views per day
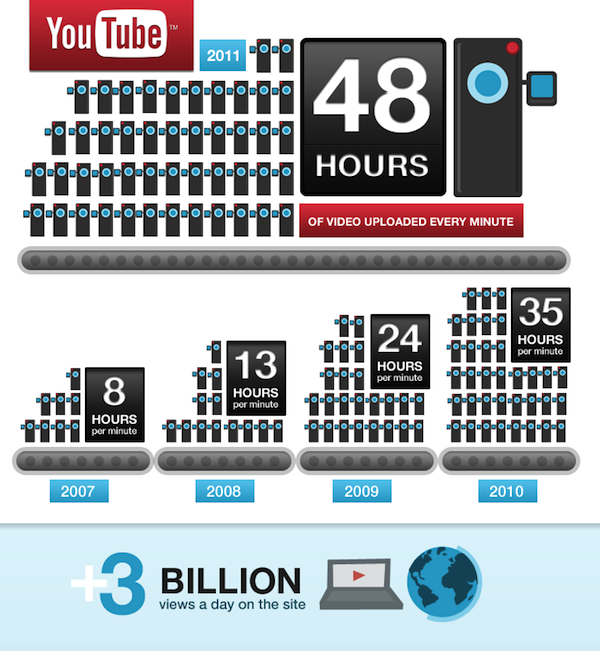
  • March 2010 – 24 Hours of video uploaded per minute
  • Feb 2011 – 490 million unique users worldwide per month

YouTube Growth & Ranking Statistics

  • #1 online video content: 142.7 million unique viewer (#2 Vevo @ 55.2 Million)
  • #2 Largest Search Engine (#1 Google, #2 YouTube)
  • #3 Biggest Site on the Web (#1 Google, #2 Yahoo, #3 Youtube, #4 Yahoo)
  • Did You Know? – 1000s of full-length movies on YouTube (WHERE!!??)

Youtube Logo RedYouTube Traffic & Upload Statistics

  • 13 Million hours of video uploaded in 2010
  • Equivalent of 240,000 full length film every week
  • More video content is uploaded to youtube in 60 days, than the three major US TV networks has done in 60 years.
  • 48 Hours of video uploaded every minute
  • Equivalent to nearly 8 years of content per day (100% inc YoY)
  • 70% of YouTube traffic from outside the US
  • YouTube is localized in 25 countries and 43 languages
  • YouTube mobile gets 400M views a day (13% of all views)
  • YouTube past the 3 billion views a day mark…

YouTube Statistics 48 hours Uploaded Minute

YouTube on Facebook & Twitter Statistics

  • 17 million people have connected their YouTube account to a social service
  • 150 years of YouTube video are watched daily on Facebook
  • 500 Tweets per SECOND contain YouTube links
  • AutoShared Tweet results in 6 new youtube sessions

Speaking of Facebook… come check out our Clean Cut Media Facebook Page!

YouTube Opinions Poll

Did you know that the average person comes to watch ONE youtube video ends up watching more than SEVEN?

Youtube is ridiculously addicting. You know it. I know it. Considering how much time is spent (wasted?) on Youtube… OPINION POLL!

[poll id=”7″]

Continue Reading

3 Ways Steve Jobs & Apple Ushered the Mobile Marketing Age [Infographic]

Mobile Marketing Statistics

As a professional who has been in the online marketing world since it’s birth, “mobile marketing” was the “next big thing” touted in every marketing conference for the past 6 years. I was always skeptical because, mobile was ALWAYS mentioned as the next big frontier, but I saw no medium in which the marketing ads could be delivered. There was no evidence or the numbers to back that claim.

Then came the iPhone, which changed everything. (RIP Steve Jobs).
Steve Jobs picture RIP

Apple iPhone (Steve Jobs) Ushers in the New Age of Mobile Marketing

Those who are just now reading articles about how Steve Jobs was a great visionary may not realize how much he really revolutionized every industry he touched. He isn’t just the CEO who introduced the iPod or the bringer of the iPhone. He literally led the way in creating products and ecosystems that created brand new industries and as a result thousands and thousands of jobs. Numerous companies out there can give some credit to their existence and growth to much of what Steve Jobs contributed to the technology sector. Think about the 100s of companies centered around building apps, or building games for the phone, apple product accessories, geo-location marketing companies, or mobile marketing service agencies. Think of all those companies centered around some product or service related to the digital music / mp3 market which not that long ago was owned by big media, then by organizations like Napster. Think about whole divisions created to tap into and create applications on tablets or all the cool little startups utilizing the social mobility of smartphones. Think about all the executives out there, innovators in their own right, sharing how Steve Jobs helped them conceptualize and grow their own companies. Apple products drove the strategy and goals of other competitors from big music labels, computer makers to phone carriers. The list goes on and on. There is a reason why Steve Job’s death has had led to such huge ripples across the nation. RIP Steve Jobs. Thanks so much for everything.

Just one of such industries that changed forever, is the mobile market.

How did the Apple iPhone change the mobile landscape?

Smartphone Becomes the Norm:
To put it simply, the iPhone made having a smartphone the norm. Only a few years back, very few had smartphones. Smartphones were reserved for the executives of big companies, mainly in the form of the blackberry. No one thought about using it as a “personal” device. It was too expensive, too hefty, seemed a bit complex. It was seen as a “professional” device. Everyone had flip phones and were content.

Then the iPhone became the “apple” of everyone’s attention. (oh no you didn’t!)

Simple. Affordable. Snazzy. Hip. Apple said, hey you want it. You need it. You can get cool apps on it. You can play games on it. You need a calendar. You need to access email instantly. You need it to watch videos. You need it to text with a bigger screen. All of syncs with your computer really easily so it’s easy to use. It was cool, it was hip, the iPhone.

Steve Jobs iPhoneSteve Jobs drove Apple to create a product that is simple and affordable for the public. Just like the iPod, iPhones took the basics of what mass consumers use (surfing the net, watching videos, taking pictures, texting), and created a product that did those things well and made it easy to use. While most of the technology world was still competing over adding more and more complex features, Apple focused on the core-uses of the consumer and made it simple and easy. Suddenly smartphones became a personal device that everyone must have. As everyone started to buy iPhones, other mobile phone competitors jumped on the bandwagon, recognizing the shift in the market. Now everyone and their mother, and their teenager daughter has an iPhone. I’ve seen kids still in middle school with the iTouch giving them free access to the internet. Which I have problems with, but that is another story.

Easier to Browse the Internet
The iPhone has also made it much easier to browse the web. Once checking the internet on your phone was so painful, that often it was just not worth it. You would have to click 24 times just to get to the article you wanted. It would be hard to read, the links were the infamous blue, taking up half the screen. Clicking on it was impossible unless you had petite fingers. Not to mention the tiny screens where web formats would break or a unfriendly page of blue links dominated the user experience. It wasn’t worth it. Don’t even get started on the ads.

The iPhone suddenly made surfing the internet, easy and simple. It was just like browsing on the computer, just on a smaller screen. Full browser, full experience (minus the flash! save the complaints!). No more nasty mobile ad formats and spammy links or 14 clicks to get back to the homepage. Surfing the net on the mobile phone became a reality.

Created an App Ecosystem

The iPhone also did a fantastic job courting developers and creating a whole “app” centered world. All kinds of creative apps were developed, as well as numerous ways to connect with the consumer. There are so many interesting and creative geo-centered applications, interest based apps, productivity apps, and all of these apps became an avenue in which marketers can use to engage the users.

Mobile Marketing becomes Legit

What Steve Jobs and Apple did was legitimize ads on mobile phones. With the iPhone, it put smartphones in the hands on the consumer, it provided a good browsing experience like nothing before, and created an world of applications which opened up even more avenues to reach the consumer.

For the last year and a half, mobile marketing has become a huge play in the online marketing world. In fact in most industries, Mobile Marketing paid traffic you can find on Google alone will be greater than all of the traffic from Yahoo / Bing Paid Search combined. The quality has dramatically improved because users can actually read, click and engage the companies that serve the ads.

So for all you working in some field related to mobile marketing, give a little thanks to the innovations of Apple.

Mobile Marketing Statistics

Enjoy the mobile marketing statistics info graphic below.

Some of the highlights:

  • 4 Billion Mobile Phones in Use
  • 1.08 Billion Smartphones in Use
  • 3.05 Billion are SMS enabled phones.
  • By 2014, mobile internet should take over desktop internet usage.
  • 50% of all local searches are performed on mobile devices.
  • 86% of mobile internet users are using their devices while watching TV
  • 200 Million Youtube Views occur on mobile devices

Average American spends 2.7 hours per day on their mobile device – socializing.

  • 61% of users use their mobile phones for Games
  • 55% to check the Weather
  • 50% for Maps and Direction search
  • 49% for Social Networking
  • 42% for Music
  • 36% for News
  • 33% for Entertainment
  • 25% for Dining
  • 21% for Video

Take our poll below and tell us how YOU use your mobile device!

[poll id=”28″]

Mobile Marketing Infographic Statistics

Mobile Marketing Infographic Statistics
Continue Reading

Most Followed Twitter Users & Brands [Infographic]

Twitter Growth History Visualized

Twitter has been growing very quickly and has changed a lot over time. In the beginning many were wondering, what was the point? Is it a bunch of teenagers chatting away?

Slowly twitter is becoming more defined as a medium of communication for businesses, brands, celebrities, customer service and a place to connect to professionals and those with similar interests. Twitter has also become a valid source of news information and quick way get a pulse on any trending topic.

Twitter Follow Me Button

Don’t forget to follow Clean Cut Media!


Some highlights from “A Visual History of Twitter” plus additional Twitter Statistics:

Record Breaking Tweet Events

  • Beyonce announces she’s expecting at the VMAs (Aug 2011): 8,868 Tweets per Second
  • Japan defeats the US in the FIFA Women’s World Cup (July 2011): 7,196 Tweets per Second
  • Japanese Twitter users set New Year’s 2011 record (Jan 2011): 7,000 Tweets per Second

Key Historical Moments for Twitter

  • July 15 2006 – Twitter Launches
  • March 2008 – 1.3 Million Twitter Users
  • April 2010 – 105 Million Twitter Users
  • September 2011 – 200 Million Twitter Users (150 Active Users

Most Followed Twitter Accounts are Celebrities (# Updated 9/30/2011)

  • #1 Lady Gaga – 14,022,983 Twitter Followers (what has the world come to)
  • #2 Justin Bieber – 12,980,136 Twitter Followers (admit it, you follow him!)
  • #3 Barack Obama – 10,304,434 Twitter Followers (rather follow obama than lady bieber)

Most Followed Non-Celebrity Accounts!

  • #1 Twitter – 6,209,226 Twitter Followers
  • #2 Twitpic – 5,354,829 Twitter Followers
  • #3 CNN Breaking News – 5,181,132 Twitter Followers (makes sense)
  • #4 Youtube – 4,943,411 Twitter Followers (also 45 million+ Facebook Fans)
  • #5 UberSocial – 4,299,424 Twitter Followers (who?…)

More Notable Brands on Twitter

  • #7 Google – 3,643,488
  • #25 ESPN – 1,892,510
  • #35 Starbucks – 1,725,548
  • #46 Facebook – 1,558,384 (/cleancutmedia)
  • #66 Itunes – 1,266,248
  • #70 Southwest – 1,175,353
  • #118 Coca Cola – 378,256
  • #135 Foursquare – 292,700
  • #180 McDonalds – 171,304
  • #221 Amazon – 122,325
  • #N/A  (help us move up the ranks!)

Interesting Twitter Statistics

  • 81% of users follow less than 100 people
  • 61% of all tweets are in English, 39% is not!
  • 42.3% of Twitter users are between 30 & 49 years old. (oldies!)
  • 30% of the users have an annual household income over $100,000 (I need some more twitter friends!)
  • Males – More likely to use Twitter for work-related research & news (true…)
  • Females – More likely to keep in touch with friends and post status updates (no comment)
  • 5% of users create 75% of the content (is that you?)

Enjoy the infographic below! Let us know what you thought was interesting!

Twitter Growth History Infographic

Twitter Statistics Infographic Growth

Continue Reading

Study says Facebook Users are Narcissist! [Study]

Child using Laptop MediaFacebook & Social Networking Influences on Children
As social media continues to grow in popularity, we are slowly starting to see more psycholgical research regarding the risks and benefits of social media / social networking use.

In a talk called “Poke Me: How Social Networks Can Both Help and Harm Our Kids,” Larry D. Rosen PhD, professor of psychology at California State University, Dominquez Hills, discussed the negative effects social media (e.g. Facebook) has had on children. Rosen conducted a study to determine how overuse of Facebook can lead to the development of psychological disorders in teens. The study was based on a sample size of 1,000 urban adolescents.

Negative points of note:

  • Teens who use Facebook show more narcissistic tendencies.
  • Young adults who use Facebook show more psychological issues such as mania, anti-social behavior and aggression.
  • Children who overuse media and technology (ex. Facebook, Video Games, TV) tends to show negative effects on health. They are more prone to depression, anxiety, and other psychological problems.
  • Middle school, high school and college students who checked Facebook frequently received lower grades as Facebook served as a distraction from studies.

Note all research was negative. Below are some positive influences of social networking.

Positive points of note:

  • Adolescents learn how to socialize
  • Young adults who use Facebook are better at showing “virtual empathy”.

Are these really “Positive” Facebook Influences?

I am not sure whether these “positives” are much of a positive at all. It is good to learn “virtual empathy” but in the long run, time is better spend for a child or an adult to learn REAL LIFE empathy. The practice of interacting and socializing in real life context may cause some awkwardness and anxiety, but it is important for children and adults alike to practice so we can become fully functioning contributors to society, our friends, and our families. I do agree that social network does have incremental opportunities to interact and socialize with others, especially those who live far away, but the fear here is when people start to opt to send messages, emails, wall posts over phone calls and real life interactions where real life opportunities are lost.

Larry Rosen’s Advice for Social Networking Use for Children

Larry Rosen, offered some advice for parents by encouraging them to pay attention to the online trends and the latest technologies they are using but be aware that it will be difficult to monitor all of your child’s social networking activities.

“If you feel that you have to use some sort of computer program to surreptitiously monitor your child’s social networking, you are wasting your time. Your child will find a workaround in a matter of minutes,” he said. “You have to start talking about appropriate technology use early and often and build trust, so that when there is a problem, whether it is being bullied or seeing a disturbing image, your child will talk to you about it.”

Social Networking Monitoring Softwares

Despite Rosen’s comments about monitoring your children, if you feel a desire to protect your child from harm, different Social Networking Monitoring tools are slowly coming to public. One such option is ZoneAlarm Social Guard. I have not used this product before, so please by all means, if you have any feedback please share in the comments below. Video introduction of ZoneAlarm Social Guard is below.

Click Here for More Info: ZoneAlarm Social Guard

Social Monitoring Tool Features:

  • Alerts you of “friends” who are much older than they claim to be.
  • Alerts you of inappropriate discussions about drugs, suicide, violence, and sex.
  • Alerts you of inappropriate links that is shared with your child.
  • Alerts you of discussions that suggest cyberbulling.
  • Parents do not need to be on Facebook to receive alerts.
  • Watches your signs that your child’s account has been hacked.

Share Your Thoughts on Social Media Usage

[poll id=”24″]

  • What is your thoughts on this study?
  • What are some other positive and negative effects you see of using Facebook?
  • In the name of irony – like our Clean Cut Media’s Facebook Page
Continue Reading

Bad Idea: eReading while Driving [Infographic]

  • Do you own a smartphone? A tablet? A eReader?
  • When do you usually use it? While in Bed? While Driving? While on the Toilet?

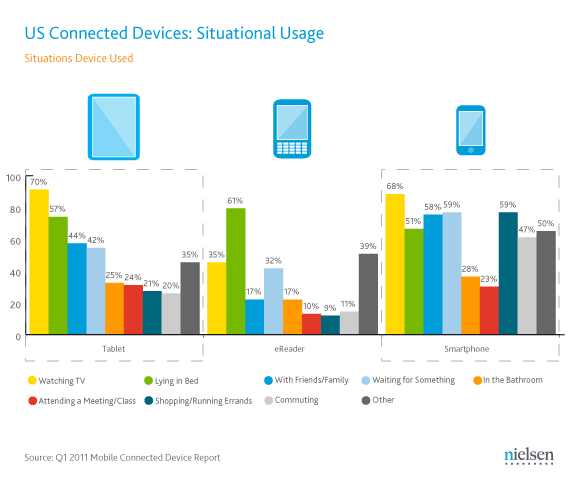
11% of eReader owners claim they use it while driving. 20% of tablet owners.

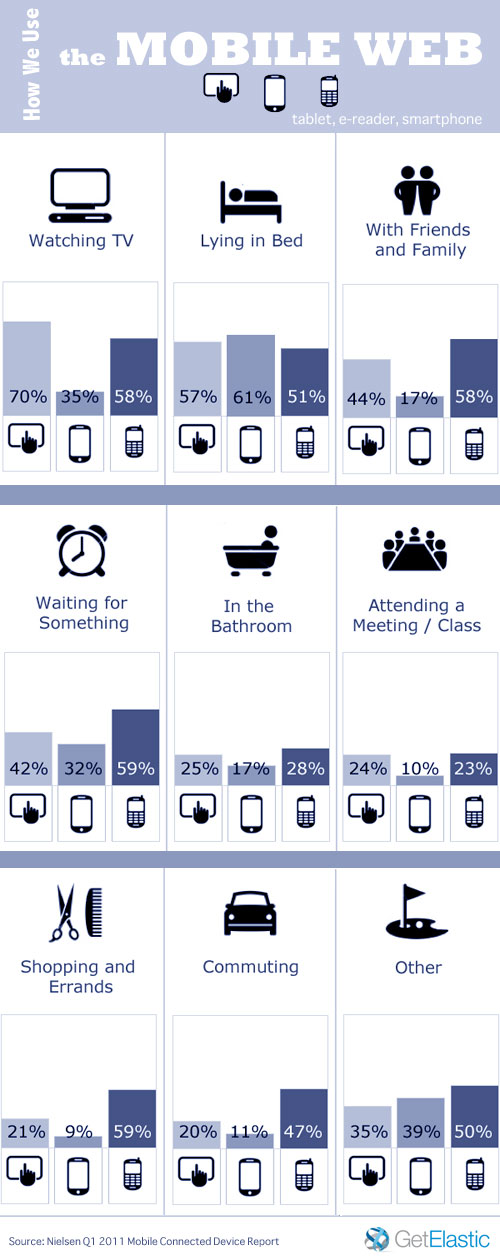
Nielsen came out with some research on how and when people use their mobile devices, from smartphones to tablets. Some of the findings are not surprising, but it’s interesting nonetheless. They surveyed nearly 12,000 mobile device owners. Take a look below at the infographic.

Mobile Web Usage Infographic

Mobile Web Infographic Usage

Original Mobile Web Usage Chart from Nielson

Mobile Device Usage Statistics

Mobile Web Usage – Quick Hit Statistics

While Watching TV: 70% of Tablet & 68% of Smartphone Owners
Have you ever wondered why the math never seem to add up on these statistical studies on media usage? How can children consume 7.5 hours of media day? 7.5 hours really? Adults consume 2-3 Hours a day online, 3 hours a day on TV, exposed to hour of TV ads. Don’t even get me started on time spend on Youtube, Facebook among other social sites. How does everyone have so much time!? I barely have time to go running (ok so it might be a motivation factor too).

The Answer? Apparently because people are consuming it all at once! 70% watch TV while playing on their tablet. I personally never do such a thing! Mainly because I don’t own a tablet… donations welcome, research purposes of course.

While Lying in Bed: 57% of Tablet, 51% Smartphone, 61% eReader

This seems very reasonable. Reading a ebook in bed perhaps, or in my case, listening to an audiobook in bed until i fall asleep. What is the latest book you are reading? Do you read in bed as well? Seems realistic and understandable… at least way more than…

While Driving: 20% Tablet, 47% Smartphone, 11% eReader!

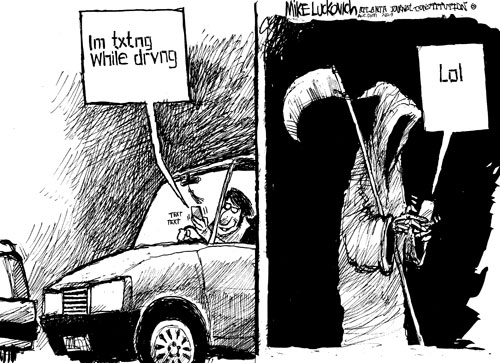
This is a seriously disturbing statistics. 11% of eReader owners, read their eReader WHILE driving? A free life tip: if you see someone reading a eReader while driving, I suggest you immediately drive away from them. Texting and Driving is bad enough (16% of all fatal crashes are due to texting and driving), but eReaders?!

“Oh I’ll never get into an accident doing this. It’ll never happen to me.” Stop and think. Did any of those people who crashed, perhaps died due to texting think they would do so? I bet NONE of them did, yet it happened.

Texting While Driving Statistics

While in the Bathroom: 25% Tablet, 28% Smartphone, 17% eReader

No Comment. I am never touching other people’s smartphones, tablets or eReaders again. Get that thing away from me.

  • So where do you use your mobile devices the most?
  • Confession Time?

Little Poll for the Weak. Comment for the Strong. Both for the Awesome.
Vote, Comment, Come back in a few days to see the poll numbers.
[poll id=”26″]

Continue Reading

Social Media Consume 1 out of every 6 Minutes

Social Media Icons Facebook Twitter YouTube

Social Networks all Consuming: Facebook, Linkedin, Twitter & More

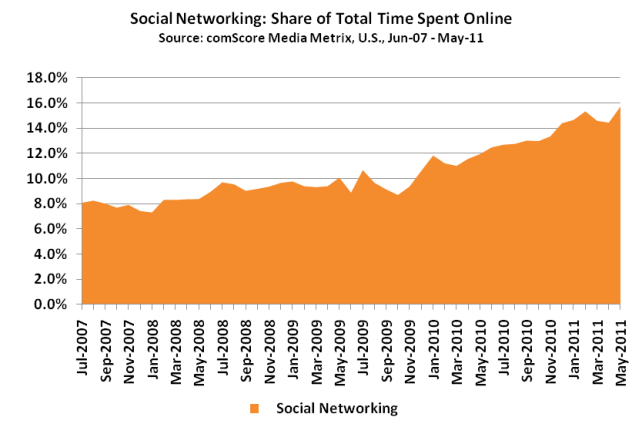
Time spent on social networking has doubled since 2007. Facebook, Twitter leads the way in the ever growing social media presence. ComScore released their latest figures on this social media growth.

The average U.S. online user spends 1 out of every 6 minutes on a social networking site.

Astounding Social Media Growth

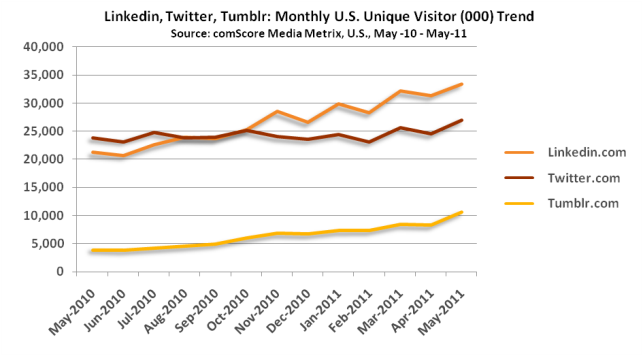
That is a whopping 16% of all online time compared to a mere 8% in 2007. Facebook leads the with 700+ million users but many social network sites like Linkedin, Twitter, and Tumblr hit all time record highs this past month of May. Linkedin recorded 33.4 million visitors in May 2011 while showing 58% overall growth from 2010. Twitter 27 million, a 13% growth from 2011. Tumblr 10.7 million with an amazing 166% growth from last year. Tumblr seems to be experiencing a sudden surge of popularity this year.

Linkedin Twitter Statistics Social

Facebook is currently the 4th largest web property with 157.2 million visitors just in the month of May reaching 73% of the total internet population every month.

Social Networking Statistics Facebook Linkedin

Linkedin IPO – Social IPOs are Coming

A new wave of IPOs are starting to pop up as Groupon and Linkedin recently went public to spectacular public offerings. Pandora just double it’s price due to demand. Facebook also has plans to IPO as early as next year. Other tech companies such as LivingSocial, Zynga and Twitter are still abuzz and potentially going public as well. Are these companies worth the evaluations they are seeing? We have yet to see. So much of the value is based on potential and potential only at this point.

  • What are your thoughts on this growth? Will it continue?
  • 1 in 6 minutes are spent on social sites.. good or bad?

Share your thoughts here and on our Facebook Page

Continue Reading

Young People More Comfortable Online than Offline

Teen Online Computer Statistics
hi. my name is... james bond

More Comfortable Online than Offline

This just in. Shocking story! A study from Kidscape, a children’s charity, showed that young people feel more comfortable with themselves online than they are offline. 45% of 11-18 year olds said they were happier online.

” [it’s] easier to be who you want to be, because nobody knows you and if you don’t like the situation you can just exit and it is over. ”

Ok. So not really shocking.
Is any of this surprising to you?

More Statistics Among the Young:

• 60 percent of these kids admit to lying about their age
• 47 percent of these kids admit to behaving differently online than offline
• 40 percent of these kids admit to being dishonest about their personal relationships
• 10 percent of these kids admit to “[changing] aspects of their appearance and their personality for their online activity”

Is any of this surprising to you?

None of it really is, and many might say, hey that’s typical, that’s normal.
But hopefully we can all agree – this is sad.

Anyone else remember lying online or perhaps have a good story about it?

Continue Reading

$1B Social Gaming Market plus w/ $653M in Virtual Good Spend!

Social Gaming is a Billion Dollar Market

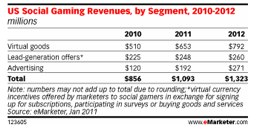
This year, social gaming is expected to become a billion dollar market according to an emarketer report. One Billion Dollars. 62 million US internet users (27% of all online audience) will play at least one game on a social network this year. Social Gaming is gaming that is done through social networks such as Facebook, that integrates social connections in the game itself. Some games supposedly integrate the connections deeply into the game play, but most are simply constructed to let others know of your status in the game and in essence “spamming” others to entice them to join.

I’m sure you’ve seen them, maybe on Facebook, “Bob has leveled up to warrior class 3 and found the golden lamp”. You get enough of those, you start wanting to hurt Bob.

Billion Dollars!? How? What are players buying?

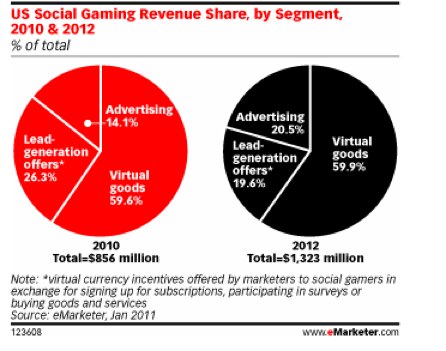
In 2011, US Consumers will spend $653 million on virtual goods in social games alone compared to $510 last year. Virtual goods is the user of money to buy more levels, weapons, hit points, items and so on. Yes, you use money to buy virtual weapons. Much of these goods tend to be low cost in nature, but when all the small spends are added up, it amounts to a huge amount of money.

In addition ad spending in social games is projected to make up $192 million, a whopping 60% increase from 2010.

Mind Boggling Virtual Goods Revenue

If you thought that was mind-boggling. Forget social gaming. As a whole, Ted Sorom, the CEO of Risty, a virtual currency platform reported that the expected global revenue by the virtual goods industry in 2010 is $7,300,000,000. That is over 7 billion dollars. 2.1 billion is from the US alone.

CityVille Virtual GoodsThink about this: Farmville’s all time high number of players if 80 million players. Cityville is recently reported reaching 100 million players. That is why I am announcing that I am currently working on games Metroville and Starville. I am going to be rich.
How is it that people spend so much money on virtual items?

Don’t forget there is virtual real estate. You can buy virtual real estate and it will appreciate in value… (I think a piece of me just died).

90,000,000: # of Pet Society Virtual Goods sold Every Day.
$635,000: World Record for single largest purchase in an online game. Yes. Online Game purchase. It was the virtual intergalactic resort in Planet Calypso. Yes. Different planet. Users actually make $100,000s of dollars in buying and selling online real estate. I on the otherhand sold a digital camera once on craigslist. I’m awesome.
10%: Percentage of overall items being resold in the after market in OurWorld. This gaming destination aggregates hundreds of third-party games into virtual world with 16,000+ virtual items.

  • Are you baffled by this?
  • Do you see why these purchase might be legitimate?
  • Did a piece of you die too?

Let us know below in the comments.

Continue Reading

How is Twitter Doing? What is it For!

How has Twitter Evolved Over the Years?

Twitter is still a hot thing, just not the hottest thing.
Twitter still has major potential and worth a whole lot of money, but it got a lot of work to do and must do it quickly to capitalize on it’s current fame.

A new study from Barracuda Labs studying 19 million Twitter accounts show that only 21% of Twitter users are active users. Active was defined as having at least 10 followers, following at least 10 people and have at least tweeted 10 times.

Let’s just get some statistics out of the way here!

  • 26% of Twitter users had 10 followers or more
  • 40% of Twitter users were following 10 people or more
  • 51% of Twitter users were following less than 5 people
  • 34% of Twitter users have not tweeted at ALL
  • 73% of Twitter users tweeted less than 10 times
  • This means that almost all of tweets come from 27% of the users.

What is the Point of Twitter?

For the majority of internet users, if they were asked what the purpose of Twitter was, they would draw a blank. No worries. You are not alone.

Twitter still hasn’t found a unique and clear identity, however, what we do know is this:

1) Social Media is Growing: Social Media continues to grow at a rapid rate. Also Facebook is carefully and strategically integrating itself throughout the web through Facebook Connect and those seemingly everywhere – “like” buttons. Trust me, it is more significant than you think. Something perhaps worth sharing in a different post.

Social Networking Growth

Firmly in the middle of this is twitter, the leader of micro-blogs. This is why they are valued so highly because no matter where the web heads, they are on a premiere position to capitalize on their huge user base.

2) Twitter is being used in several unique ways that are becoming more firm and established.

Here are a few.

  • Breaking News
  • Customer Service – saves $
  • Thought Leadership / Personal Branding
  • Humanize Corporations / Customer Learning
  • Viral Marketing

Twitter Awareness Statistics

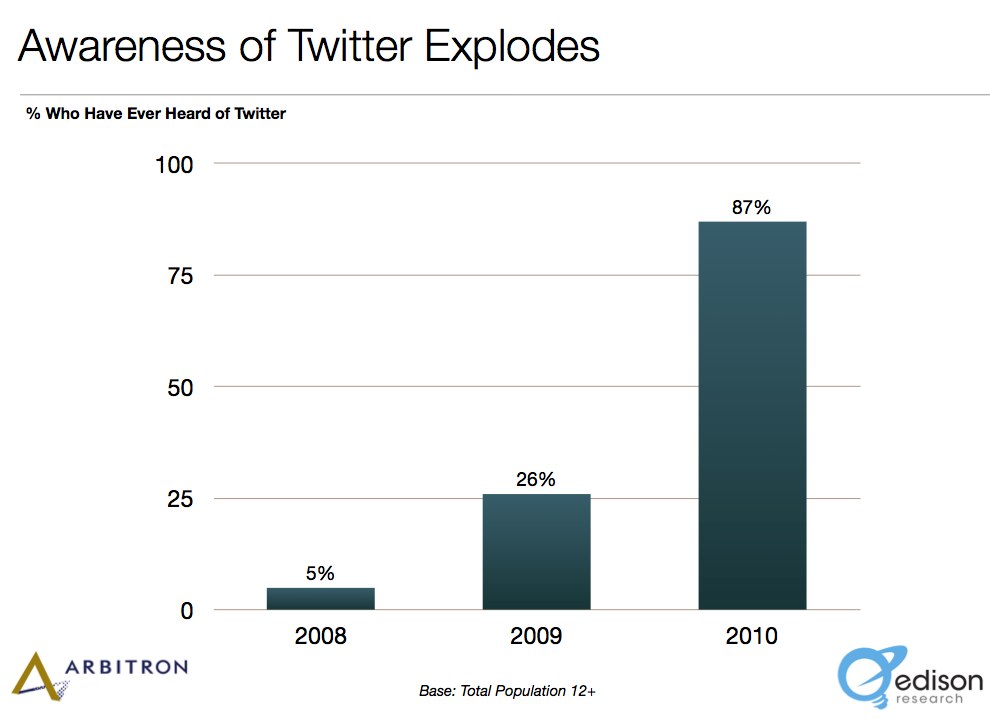
Edison Research and ARbitron Internet recently surveyed 1,753 Americans revealing that awareness of twitter has grown tremendously in the last few years.

2008: 5% were aware of Twitter
2009: 26% were aware of Twitter
2010: 87% were aware of Twitter

Awareness of Twitter Statistics

Twitter vs Facebook Usage Statistics

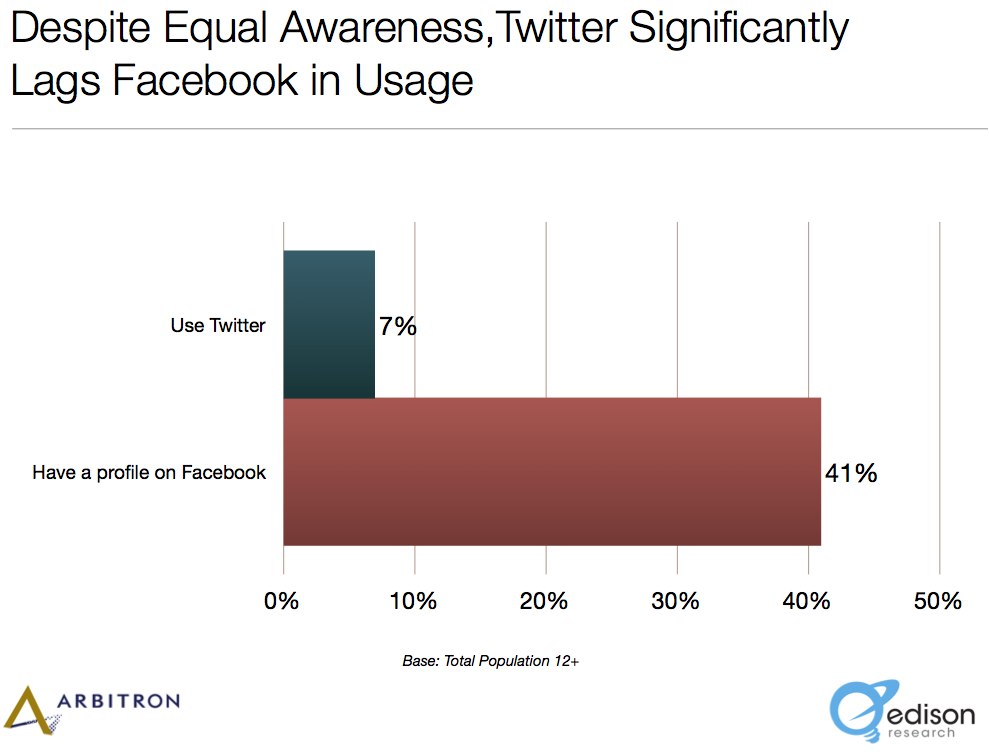
Though Twitter is now as well known as Facebook, it continues to lag behind in actual usage.

Twitter Facebook Usage Comparison

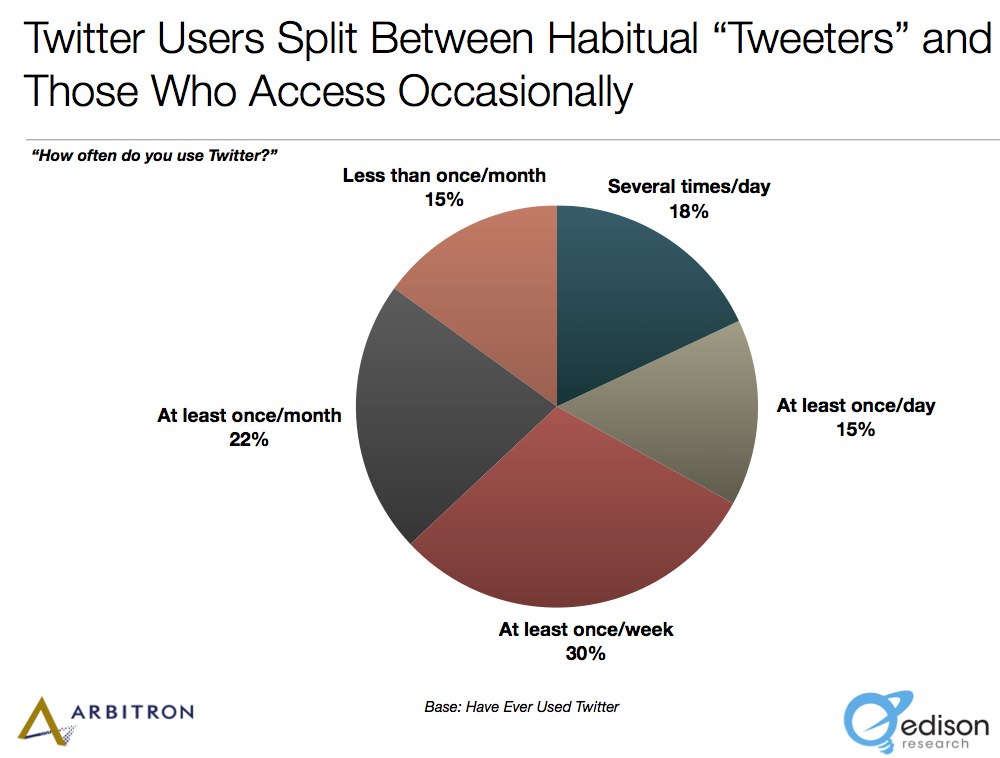
More Twitter Usage Statistics

Twitter Usage Statistics

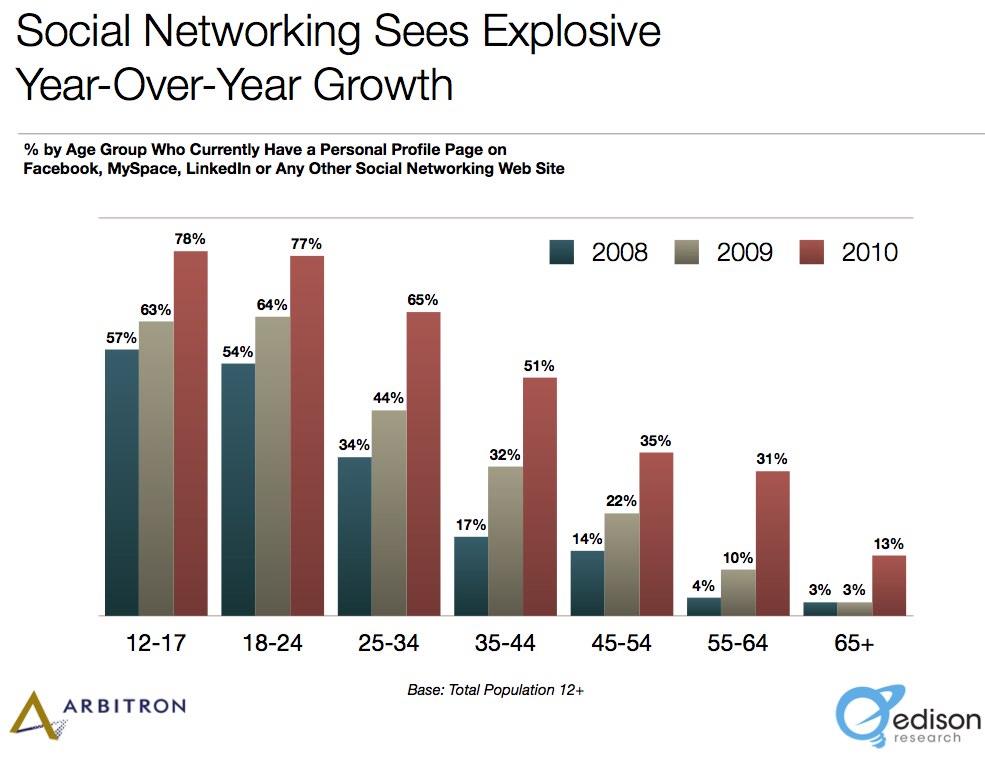
Twitter Demographics Statistics

I am not using Twitter. So who is using Twitter anyway?
Is it just a bunch of kids tweeting away?

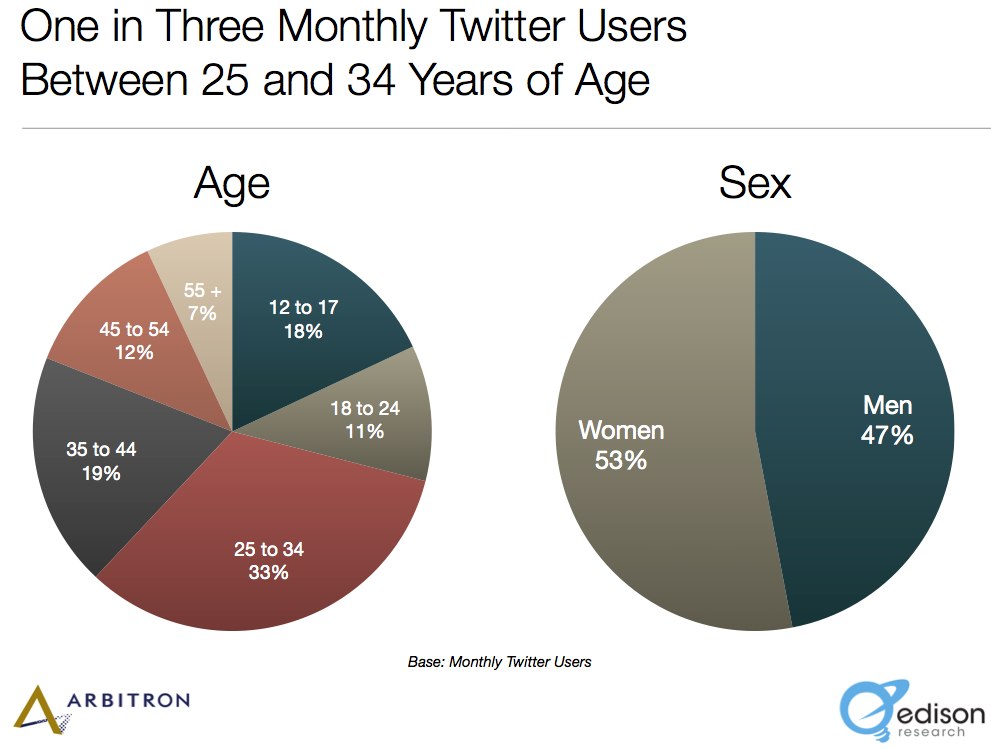
People might be surprised to know that twitter has an older demographic than one may initially think. Twitter is actually not adopted amongst the teenagers as much as people initially would have guessed. In fact 71% of Twitter users are 25 and older. Much of Twitter is also used by business professionals, marketers, corporations and quickly becoming a great medium for businesses to engage their customers.

Twitter Demographic Statistics
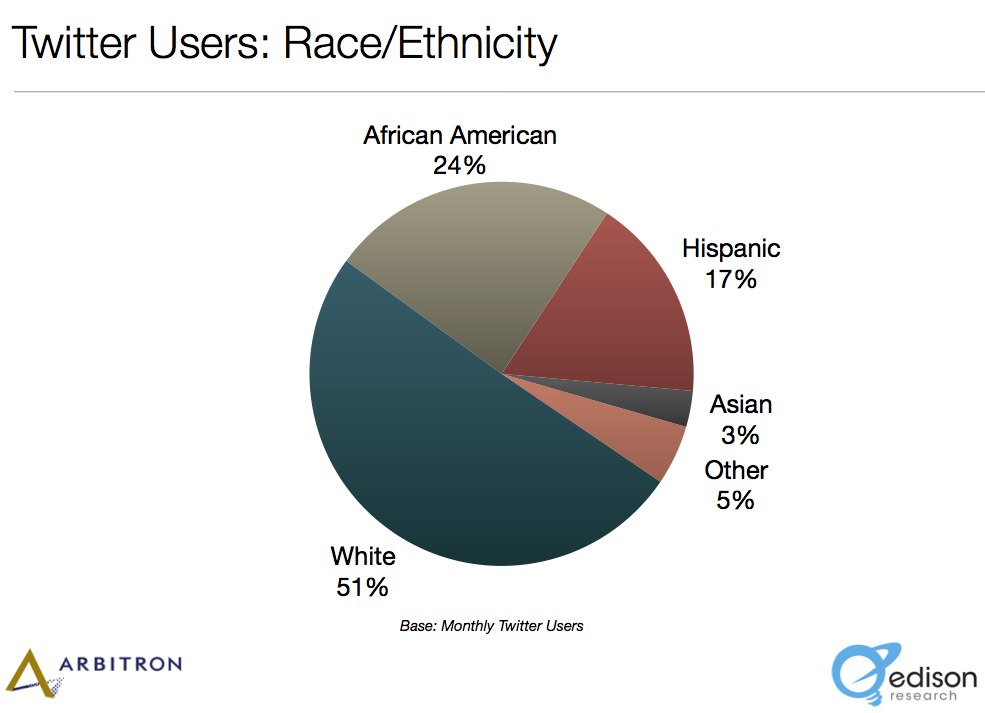
Twitter Ethnicity Statistics

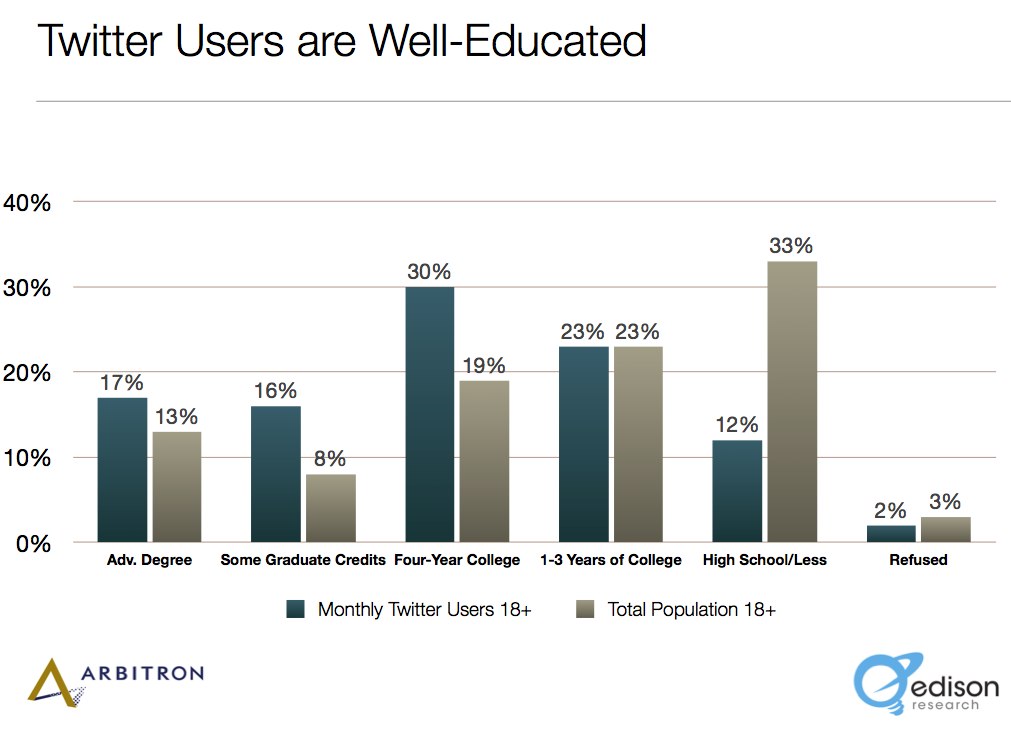
Twitter Users are Educated

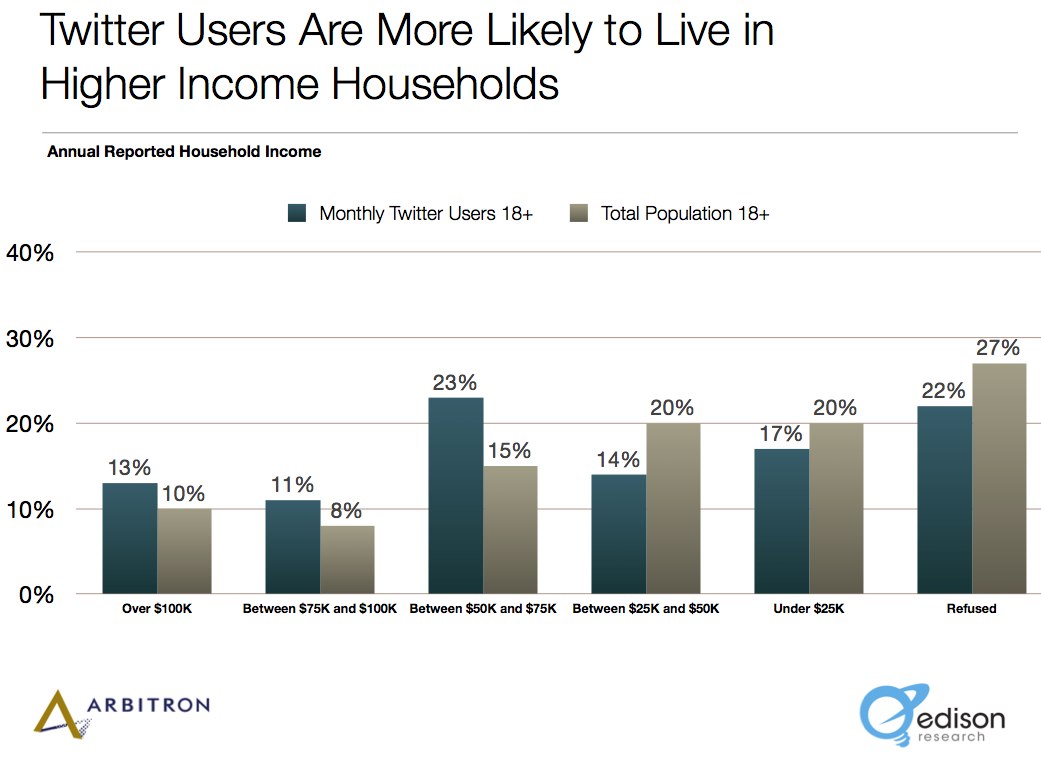
You may look at Twitter and say how pointless it is, however Twitter has very high adoption rates with educated individuals and those with higher incomes. It has become useful for networking and connecting to other professionals as well as a great source for reading up on the news.

Twitter Education Statistics

Twitter Users are Mobile

25% of Facebook users access Facebook using a mobile app or browser. Twitter, probably due to it’s simplicity and a long list of third party apps, show 63% of users have accessed the service with their mobile phone.

Twitter is an Exchange for Products and Services

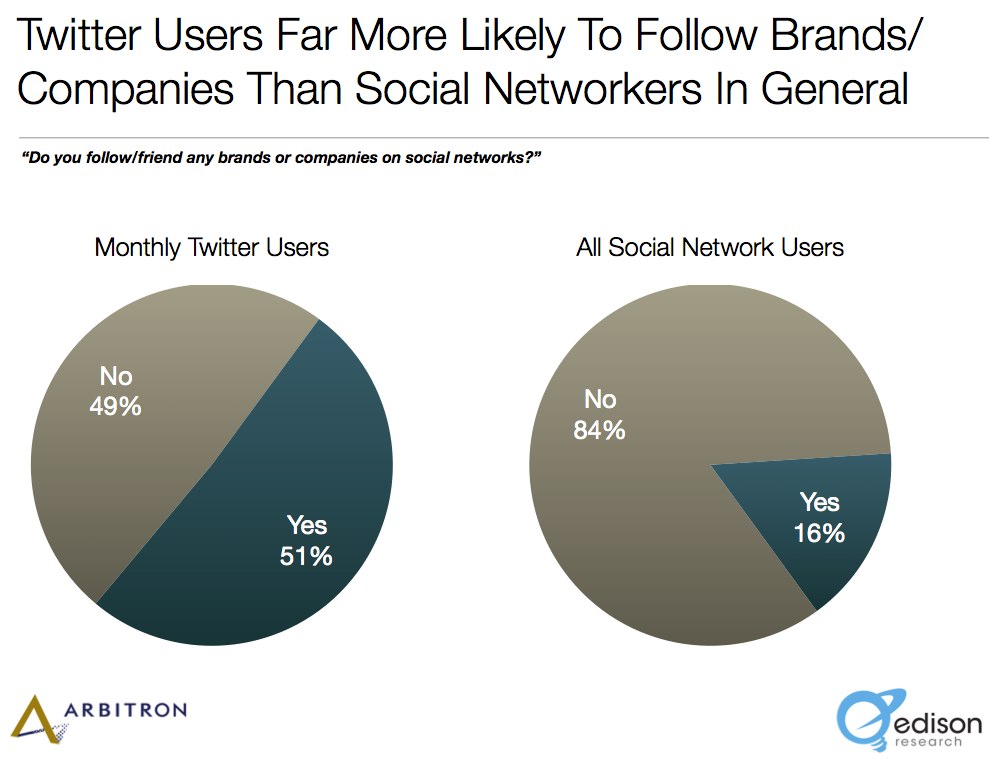
Twitter is also becoming a key way to engage consumers, customers and networking with other professionals. Over 40% of users use Twitter to learn about products and services. 28% are using  Twitter to find discounts and special offers. 20% seek customer support. On the business end, over 30% have used it to poll their customers and users and many corporations have adopted Twitter as a way to serve their customers (while cutting down customer service costs!).

Twitter Follow Brands

More Stats for the Twitter Business Mind

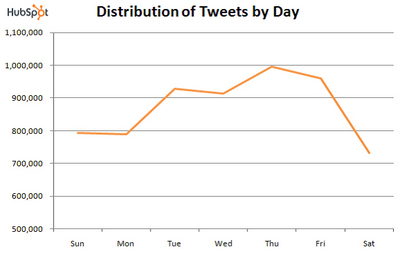
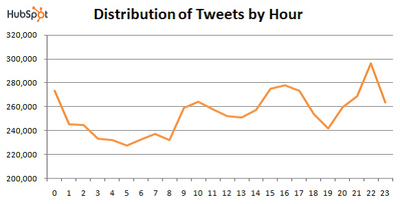
Interesting Data on When Twitter Users are most Active. Useful if you are a twitter marketer trying to determine the optimal time to reach your users.

Highest Usage Days: Thursday & Friday
Lowest Usage Days: Saturday & Sunday

Twitter Usage By Day Statistics

Twitters are Night Owls

Twitter Hour by Hour Statistics

Other Rule of Thumb Advice:

  • More you tweet links, the less likely people are going to click those links
  • Know when your user are most active and tweet during those times to maximize engagement
  • Highest click thru rate tends to be early evening right after work hours.
  • Weekend has lowest volume but has shown highest click rates
  • Fridays have the highest % of retweets

Share your thoughts on Twitter

  • So Are you a Twitter User?
  • Do you think Twitter is useful?
  • Do you think Twitter is a fad or is it here to stay?


[poll id=”13″]

Continue Reading

Did You Know 92% of Toddlers Are Online!

Baby on Laptop Computer92% of US Toddlers have Online Presence!

The Internet security firm AVG, recently released a study of 2,200 mothers across the revealed that 81% of children 2 years or younger have some form of online presence! How much has the internet grown that 4 out of 5 kids are online so early on in their life. Online presence could mean anything from an uploaded video of their child, some photos up on the web, or in some cases a full profile on a social networking site.

Some Quick Statistics:

  • 81% of children have online presence before the age of two.
  • 92% of US children
  • 73% of European children

23% of have an online presence BEFORE THEY ARE BORN

Wait What? That is right. 23% of parents share images from their prenatal sonograms on the web. In the US, this jumps to 33% of parents. This means the children are on the web before they are born!

% of Children with Sonograms Online

  • 37% in Canada
  • 33% in US
  • 14% in Western Europe
  • 14% in Japan

I find it surprising Japan isn’t hire on this list considering how modern and progressive the country tends to me with technology.

What other things do babies have!

How about these statistics?

  • 7% of babies & toddlers have an e-mail address
  • 5% have their own profile on a social network

How spooky would it be when you try to open a facebook account only to discover you are already on the web. And your parents have been posting cute, embarrassing pictures of you since.. you were born?

Why Do Parents Do This?

  • 70% – Wanted to share with friends a family (understandable)
  • 22% – Wanted to expand the content on their social networking profiles (ok – I can see that)
  • 18% – Merely mimicking their peers (some things don’t change with age)

Can’t You Remove Online Photos & Information Later?

Only 3.5% expressed concern about the amount of information that would be available about their children in future years…

Well consider this- most 30 year olds have an online footprint stretching back 10 to 15 years. That is amazing in itself, but these children will have an online footprint – for a longer time then they have lived!

Will all the information that are posted be available in the future years as the few 3.5% parents were concerned about? I’ll solve the mystery right now. YES. Once content goes on the web, it’s pretty much there forever, no matter what you try to take it away. It is very important for parents to think carefully about what kind of information they will be sharing about their children online. It will follow them for the rest of their life. Anyone can see it. Friends? Job Hiring Managers? If they ever become politicians or someone high profile – all of it will be publicly available.

  • What are your thoughts?
  • How much presence does your children have?

Take the poll below, and give us your thoughts in the comments!
[poll id=”22″]

Continue Reading

Emailing in Bed, when Sick & on Vacation

Doing Business in Bed, when Sick & on Vacation

Checking Email Keyboard

  • How often do you check your work email?
  • Every day? Every couple hours? Every hour?

As internet access becomes more available everywhere from cafes to bookstores to the booming smartphone market, checking email has become almost second nature for most individuals.

A recent survey by Harris Interactive conducted in the US and in the UK, showed that for Americans, 72% of the people check work email during non-business hours, 19% check emails in bed, and a whopping 50% of the people check email during vacations or day off.

Email Statistics

Here are some of the US emailing stats laid bare:

  • 72% of people check work email during non-business hours
  • 19% check email in bed (21% of men, 16% of women, 31% of 18-34 year olds)
  • 50% check email during vacations and days off
  • 42% of Americans check work email when sick at home (26% in UK)

Of those checking on non-business hours:

  • 27% check because they are expected to provide quick responses (20% in UK)
  • 37% are afraid they may miss something important (45% in UK)

How often do you check work email?

[poll id=”21″]

About The Email Survey

This survey was conducted online within the United States by Harris Interactive on behalf of Xobni from August 5th to 9th, 2010 among 2,200 adults ages 18 and older. This online survey is not based on a probability sample and therefore no estimate of theoretical sampling error can be calculated.

Continue Reading