New Social Media Revolution 2013 Video

Social Media Revolution 2013 Video

A refresh of Socialnomic’s Social Media Revolution video is out. The numbers are staggering and continue grow in a phenomenal pace. Whether this incredible social media growth good for our world or bad is hard to tell. Last time we left off Social Media was consuming 1 out of every 6 minutes… now?

  • Over 1 billion users on Facebook – making it the 3rd largest in the world. China, India, Facebook than the US.
  • Over 50% of the world’s population is under 30-years-old
  • Each day 20% of Google searches have never been searched before
  • In 10 years over 40% of the Fortune 500 will no longer be here
  • Social Media is the #1 activity on the Web, though still not allowed in China.
  • 1 in 5 couples meet online; 3 in 5 gay couples meet online
  • 1 in 5 divorces are blamed on Facebook
  • Ford Explorer launch on Facebook generated more traffic than a Super Bowl Ad
  • Generation Y & Z consider email passe: Some universities have stopped distributing email accounts due to use of social media
  • Kindergarden is learning on iPads
  • 69 percent of parents said they are currently “friends” with their children on a social media site
  • 92% of children under the age of 2 have a Digital Shadow (online presence/video/profile)
  • Every second 2 new members join Linkedin
  • That’s is like the entire enrollment number of the Ivy League School joining every day.
  • Social Gamers will purchase 6 billion in virtual goods by 2013. Compare to movie goers who only by 2.5 billion in real goods
  • YouTube is the 2nd largest search engine in the world (After Google)
  • Every minute 72 hours of video is uploaded to YouTube
  • If Wikipedia were made into a book it would be 2.25 million pages long
  • 97% of Pinterest Facebook Fans are Women
  • 53% of people on Twitter recommend products in their Tweets
  • 90% of people trust online recommendations from people they know
  • Only 14% trust traditional TV advertisements
  • New Yorkers received tweets about an east coast earthquake 30 seconds before they felt it
  • 93% of marketers use social media for business
  • Lady Gaga, Justin Bieber and Katy Perry have more Twitter followers than the entire populations of Germany, Turkey, South Africa, Canada, Argentina, United Kingdom, Egypt
 

  • Social Media Icons Facebook Twitter YouTube“We don’t have a choice on whether we DO social media, the question is how well we DO it.” – Erik Qualman
  • “We will non longer search for products and services, they will find us via social media.” – Erik Qualman
  • “Social Media isn’t a fad, it’s a fundamental shift in the way we communicate.” – Erik Qualman
  • “The ROI of social media is that your business will still exist in 5 years.” – Erik Qualman

Social Media Revolution 2013 Thoughts

  • Which statistic do you find most surprising?
  • Most interesting?

Previous Social Media Revolution Posts:

Social Media Revolution Video 2009
Social Media Revolution Video 2010

[poll id=”24″]
Continue Reading

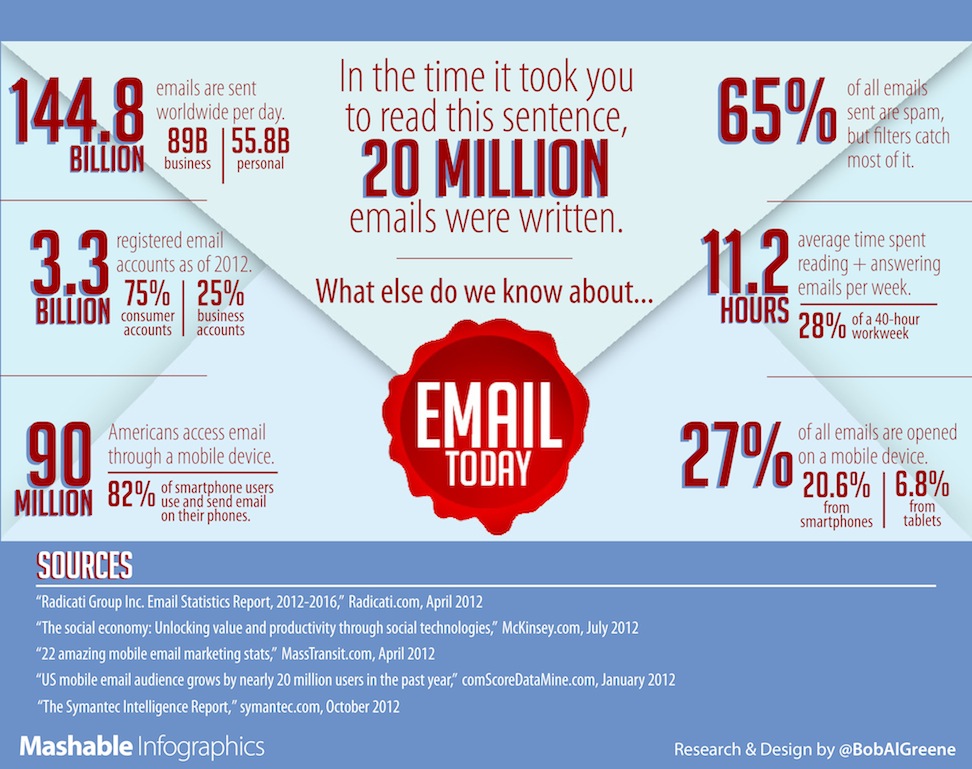
Yipes. 144.8 Billion Emails are Sent Every Day!

In the time it took you read this sentence, 20 Million emails were written!
If you are a slow reader, maybe even more!

Question about Email Use

  • How many emails do YOU send per day. 10? 20? 50? 500? Yes you!

Yes this includes quick replies, personal and work related.

  • Please respond in comments below as well as take our polls!

(You may need to return later to see more results!)

Email Statistics Infographic

  • 144.8 Emails are sent worldwide per day
  • 3.3 Billion registered email accounts as of 2012
  • 11.2 Hours – Average time spent reading & answering emails per week
  • 90 Million Americans access email through a mobile device
  • 27% of all emails are opened on a mobile device
  • 65% of all emails sent are spam
[poll id=”35″]
[poll id=”21″]
Continue Reading

Can’t Sleep? It’s the iPad’s fault. Study says so.

iPad Use Affects Sleep Study

Blurring the lines between Work & Home – Mobile Style

BYOD: Bring your own device. More and more, professionals are using mobile devices and blurring the lines between work and home. With the booming popularity of iPhones, iPads, and the use of laptops in corporate settings, one study showed that the average American worker works nearly seven hours a week outside the office. 80% of professionals do some sort of work past the end of the workday. This involves anything from answering phone calls and answering emails. 60% of those who work after workhours said it helps them to stay organized and nearly half said they feel like they have no choice.

One way in this impacts our private lives is that it makes it more difficult for us to “switch off”. 31% of Americans say they have a hard time switching gears from work to home. 50% respond to emails in bed, 69% said they have to check email before going to bed, and 40% send work-related emails as late as ten at night. Then 68% of us start each morning by checking our emails. 50% check before getting out of bed.

Having Trouble Sleeping? Blame the iPad!… Maybe

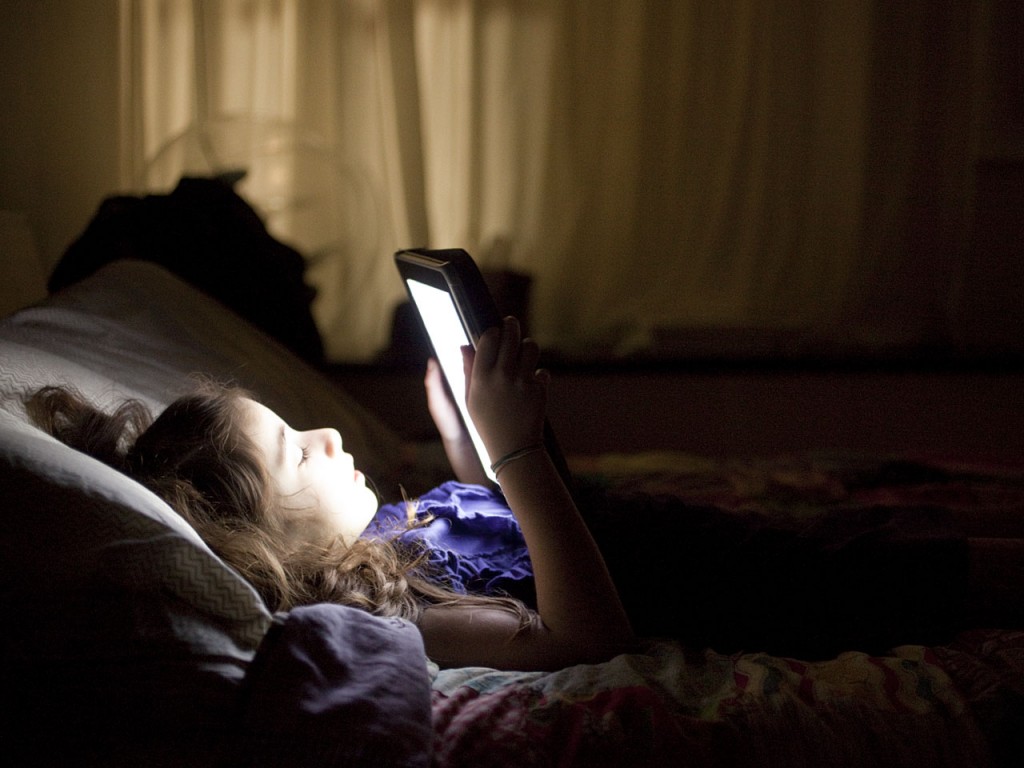
A recent study by researchers at Rensselaer Polytechnic Institute’s Lighting Research Center, studied the impact of backlit devices such as the iPhone and iPad at on our production of Melatonin. Melatonin is a hormone produced by the pineal gland that helps induce drowsiness and lower body temperature, both important to help us to fall sleep. The research shows that two ours of tablet use before bed can suppress melatonin production up to 22%. In English, that means tablet use is making it harder for us to fall asleep as it affects our ability to naturally get drowsy. It is also associated with increased risk for diabetes and obesity and some mental health disorders. The study was only done on 13 people so take it with a grain of salt, but it does bring up the question:

  • Do you use your iphone, ipad or other mobile devices before going to bed?
  • Do you feel it helps you sleep or only delays you going to bed?
  • Do you feel the urge to check email or facebook before you go to bed? When you wake up?

Share your thoughts!

Continue Reading

Can We Live Without Smartphones? Statistics Says You Will Panic

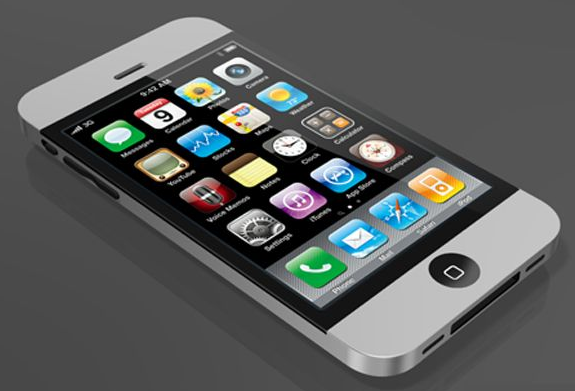
iPhone 5 Smartphone Design

Can We Live Without Smartphones? Statistics Says You Will Panic

QUESTION:
How much time you spend a day staring at your smartphone?
How many of you have an iPhone but really don’t need it? Honestly.

Is it the first thing you grab for when you wake up in the morning?
The last thing you look at before you go to bed?

  • 54% of people say they do all of the above.

A study sponsored by Lookout, says that we often put more time in our phones than in real personal relationships. in fact the way we think, behave and the emotions we feel is more and more developing into a new “mobile mindset”.

“The findings establish that our attachment to smartphones is driving a new mobile mindset. Our behaviors, emotions and social interactions are impacted by smartphones to the extent that they now play an important role in our value systems.” – Alicia DiVittorio, Lookout

Smartphone Dependency Statistics

We are obsessed with staying connected on our phones.

  • 60% of respondents say they don’t go an hour without checking their phones.
  • 63% of women and 73% of men between ages 18 to 34 don’t go an hour without checking their phones.

Rules of etiquette are also changing or being challenged.

  • Nearly a third of respondents say they check their phones while sharing a meal
  • Nearly a quarter of respondents say they engage in risky behavior such as checking their phone while driving.
  • 10% check their phones during religious services

The Study also suggest we are also emotionally attached to our devices

  • Nearly three-quarters of respondents felt “panicked” when they misplace their phones.
  • 14% said they felt “desperate”
  • 7% said they felt “sick”
  • Only 6% said they felt “relieved”

How Are You with Smartphones?

So let’s discuss.

  • How much time you spend a day staring at your smartphone?
  • Is it the first thing you grab for when you wake up in the morning?
  • The last thing you look at before you go to bed?
  • Do you see us getting more and more dependent on Smartphones?
Continue Reading

Should Children be Allowed on Facebook?

Child Laptop Internet Facebook

Children Allowed to Open Facebook Accounts?

News is spreading.

Facebook is considering allowing children under the age of 13 to have accounts on Facebook.

The question would had to have come sooner or later as means for continual Facebook growth. Previously anyone under the age of 13 were not allowed to have accounts, though a Consumer Report study estimated that out of 20 million minors on Facebook, 7.5 million of these children were younger than 13. Among these users, 5 million were 10 years or younger and were not being supervised by their parents. Age restrictions have always been difficult on the internet.

This is not a simple matter of whether to let kids have access or not. Keep in mind, part of the reasoning in keeping young children on Facebook is the incredible dangers that it poses.

There are the obvious factors most people would know, such as the presence of sexual predators, and creepy people talking to kids. Also one million kids were harassed, threatened, or cyberbullied on the past in the last year (Consumer Reports). There has been numerous studies on how the internet and social media cause anti-social behaviors in hyper-connected children. We here at Clean Cut Media even posted an infographic about how the internet is ruining your brain! But even more than these obvious issues, there are many other dangers not as well known. For example:

Dangers of Children on Facebook You May Not Know

Photo Accessibility: Photos posted on Facebook or the internet in general can easily spread very quickly. As they say once it’s on the internet, it’s there forever, even if you delete them. Even if you were careful, it can easily be grabbed by someone and posted elsewhere. There are many instances were lives were ruined because of some poor Facebook photo going viral. This is not only for photos you upload, but photos your friends may upload or you upload of your friends. Many lives are ruined because of one photo uploaded by someone who didn’t think through the consequences.

Abuse of Knowledge: Another example many do not consider is how sites like Facebook are used for theft and burglary. Did you just say you and your family are going on a awesome 3 month vacation to Europe? You just announced your home will be vacant for 3 months. It’s scary to think about, but consider how else more dangerous people can utilize such information.

Inappropriate Content: How about dangerous and inappropriate links shared by friends, strangers, malware or clicked on by accident as they surfed the web?

Is your daughter posting pictures of themselves all over the net? Who can access those? Download those?

Any Other way of Handling Pre-Teens on Facebook?

Some may argue that the children are already on it anyway and more should be done to help allow parents to monitor. Is that Facebook’s responsibility to provide the tools to do so or does it mostly lie on the parent? How about the idea that Facebook create a separate sub-site for those under 13 with strict monitoring tools and filters as well as an easy way to transition the account to the main facebook platform? Food for thought. Share your ideas!

Should Children be Allowed to Use Facebook?

So Question:

  • Do you support Facebook opening up to pre-teen accounts?
  • What is the best way for parents to help monitor or prevent children from making terrible mistakes?
  • At what age do you think, children have the capacity to think intelligently about these things?

[poll id=”34″]

Continue Reading

Does Anyone Read Books Anymore? Be Surprised!

Book Stack - Old AncientHalf of Americans are Reading a Book! [Statistics]

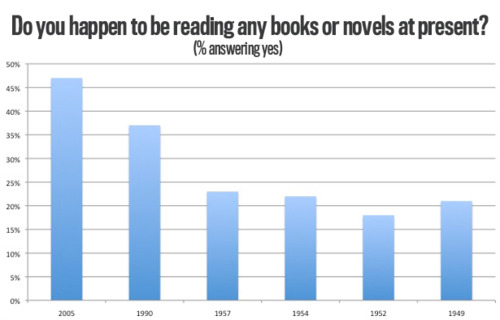
Did you know in 1957, less than 25% of Americans were reading a book or a novel according to Gallup Poll? By 2005, that figure had risen to 47%. This means one if every two Americans are actively reading a book. Half of Americans also said they have read more than five books this past year. 

  • How many have you read this past year?

With the media onslaught of movies and video games, you may have thought reading was a lost art. I would have had thought the same, but these figures show that more people are reading than before. Perhaps it is because there was just a lot less books back then? But as recently as 1990 the poll show the reading rate was much lower at 37%.

Internet Reading Novels & Books

What do you think is causing more people to read?

  • MORE BOOKS: Is just more books in print?
  • MORE ACCESS: Affect of easy purchase through sites like Amazon and eBooks through iTunes?
  • MORE SHARING: Is it the proliferation of communication mediums like the internet where we can share our thoughts on books on forums and Facebook?
  • MORE GADGETS: Perhaps more gadgets like Kindles and iPads to make reading easier (and cooler) than ever?
  • MORE BLOCKBUSTERS: Is it the popularity of  big series like Harry Potter and Hunger Games?

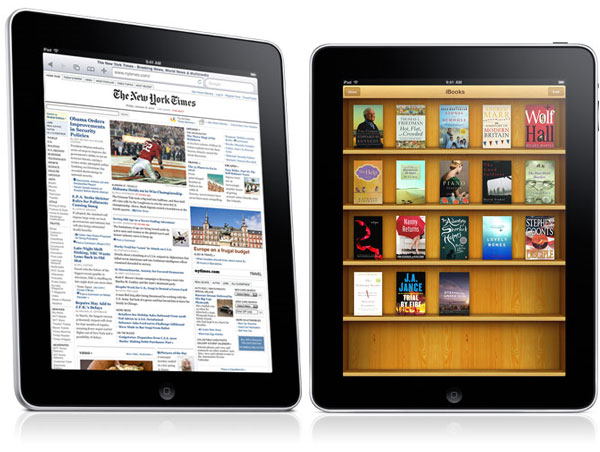
Ipad Book Reading MagazineClean Cut Media’s Take: More people are reading books because of one word – “EASY”. It’s easy to find out about new great books through the internet. It is easier to read up on numerous book reviews and peer reviews through websites, forums and social networking. It is easier to purchase a book. No longer do we go through a local Barnes n’ Noble to find a book and pay $25 for a book when it’s $10 on Amazon Books with a click of a finger.

Who is Doing all the Reading?

in 2005:

Gender: Female (53%) vs. Male (42%) – 11pt differential!
Age: 18-29 (40%), 30-49 (47%), 50-64 (51%), 65+ (47%)

Battle: Movies vs. Reading Books

One interesting reading statistic is that those who frequently watch movies tend to also read more books.

Watch a Lot of Movies makes you read Less, or More?

  • High Frequency: 62%
  • Moderate Frequency: 49%
  • Not at All: 33%

At first, this may seem counter intuitive since people often bemoan how nobody reads books anymore but rather just watch tv and movies. Yet perhaps the stronger correlation lies in a person’s desire to get lost in a story. Both mediums does provide that avenue in which someone can get pulled into a whole different world.

  • Why do you think there is a correlation of movie watching and book reading?

How do People Find New Books to Read?

Not much has changed from 1999 to 2005. Below are the % statistics for 2005.

  • Choosing an Author whose book you like: 30%
  • Based on Recommendation from someone you know: 27%
  • Browsing a bookstore or library: 22%
  • Based on Book Reviews: 7%
  • By Subject: 6%
  • By Browsing an Internet Site: 3%
  • Advertisement You’ve Seen: 2%
I personally rely heavily on User Reviews found on Amazon or in my case on Audible since I tend to go to Audiobook route. Got to be productive on commutes!

iPad Book ReadingThe Rise of e-Books. Do People Read it?

In a survey by Pew Reserach Center, 21% of U.S. adults said they have read an e-book within the past year. As Kindles & iPads become more and more popular, more people have been getting into e-books. The average # of books read by a reader of e-book is 24 books compared to 15 books for those who only read print.

  • Got e-Book on Your Computer?: 42%
  • Use an e-Book Reader like Kindle or the Nook?: 41%
  • Read e-Books on Mobile Phone?: 29%

Tell us what you think!

  • What do you think about these stastistics?
  • Why do you think more people read now then before?

[poll id=”33″]


Continue Reading

How the Internet is Ruining Your Brain [Infographic]

Internet Use & Depression Statistics

This has to be the ugliest, most mind draining infographic ever made. However, the statistics are interesting a relevant so put on your thinking caps, take off your creative sensibilities and check out the statistics below! Highlights written out for the faint of heart.

Statistics: How the Internet is Ruining Your Brain

Internet Depression Sad TeenInternet Usage Statistics

  • 35 Billion: Collective hours we spend on the internet per month
  • 3x: We consume 3x more information than the 60s’ (not that I would know)
  • 61%: Admit to being addicted to the Internet (that means either you or I are addicted. It’s you… i think)

Multitasking the Internet

  • Frequency: We Change Windows/Check Email/Programs more than once every 2 minutes
  • Avg Tabs Open: See chart below. It’s a lot. How many do you have open right now!

Google is Great, but makes you Dumb

  • 7.2 Billion: # of times we collectively visit Google per day
  • 3 Billion: # of queries we collectively make per day

Social Networking – Growing # of “Friends”

  • 8 Hours: # of hours a month we spend on Facebook
  • 245: Avg # of Friends
  • 73.2%: Percentage of those friends we really know
  • 4%: Percentage that we would actually hang out with

Internet Causing Happiness or Depression?

  • Heavy internet users are 2.5x more likely to be depressed (chicken & egg?)

Internet Depression & Usage Statistics

Share Your Thoughts

Use your brain a bit.
Seriously Google makes it so easy to look up information as it is needed. How did we live without Google back in the day? Hmm… can’t remember. I better Google it…

  • How many tabs do YOU have open?
  •  Do you agree the Internet is causing some bad mojo?
  •  Does your head hurt from trying to read this infographic?
[poll id=”19″]
Continue Reading

How Much Data does Your Child Use Per Month?

Mobile Data Usage Statistics

DID YOU KNOW:

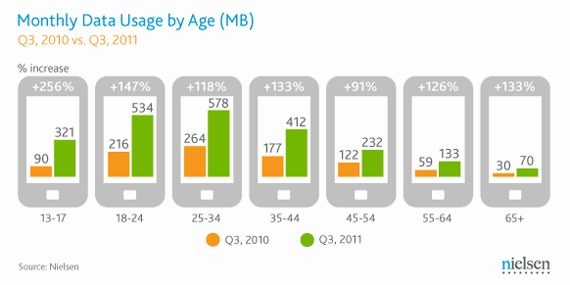
  • Teens ages 13 to 17 use on average 320MB of data per month?
  • Adults ages 25-34 use on average 578MB of data per month?

A study by Nielson analyzed mobile data from 65,000 U.S. subscribers. Smartphone users using mobile internet has increased 45% this year. Take a look around. Before the iPhone revolution, who among the people you know had smartphones? Very few people I imagine.

Mobile Data Usage Infographic

Teens & Texting: Where are Thou Social Skills?

We’ve had many article here following the incredible growth of text usage among teenagers. During Q3 of 2011, female teens had reached 3,952 texts per month. Male teens were at a “paltry” 2,815 per month. It wasn’t long ago that I was fine with a 200 txt msg plan! Not anymore.

Some people argue that social networks and easy communication access is lowering children’s ability to socially connect with others. Well this latest crop of statistics show that voice minute usage is dropping among teens. it dropped 17% year over year as they opt to text as it is faster and easier. An older poll from 2011 of 500 social networking Americans between ages 13 to 21, showed that 71% of the respondents preferred texting to phone calling. Ok, confession time. I would fall in that category as well. It is indeed easier and quicker, but do you think it has an adverse affect? Will it hurt social abilities and limit experiences for children and teens who grow up texting, talking online, messaging on Facebook, and IMing on gchat. I would argue, yes it would have an effect, though it may not be obvious or all that dramatic at first. I’ve worked with enough college students and youths to know, it could potentially become a problem.

  • What do you think?

Mobile Texting Statistics for Teens

  • 45% of teens send at least 30 texts a day
  •  54% of teens say they are just “chatting”
  •  14% text in class
  •  17% text while riding in a car
  •  10% text during a movie
  • Teens Ages 13-17 average 3417 text messages per month
  • Equivalent to 7 texts per every waking hour
  • 18-25: 1,914 texts per hour
  • 25-34: 928 texts per hour
  • 95% use phone for online gaming
  • 66% use to stream music

[poll id=”15″]

Teen Cell Phone Usage Statistics Infographic

Teen Texting Statistics Infographic

Infographic Courtesy of OnlineSchools

Continue Reading

Is Being Hyperconnected Hurting or Helping our Children?

Children Laptop Online InternetDid you know a lot of employees of leading high-tech firms in the silicon valley such as Apple, Google, Yahoo, and Hewlett-Packard send their children to a computer-free school?

Schools nationwide have rushed to supply their classrooms with computers, and many policy makers say it is foolish to do otherwise. But the contrarian point of view can be found at the epicenter of the tech economy, where some parents and educators have a message: computers and schools don’t mix. – NY Times

So then comes the questions:

  • Why would high tech employees and internet executives who are so immersed in technology not want their child to use such technology to learn? Do they know something we don’t?
  • Does the use of technology potentially hurt child development…. adult development?

SURVEY: Will Millennials Benefit or Suffer Due to their Hyper-Connected Lives?

A recent survey released by Pew Internet Projects asked technology experts about this issue. The question: Will Millennials benefit or suffer due to their hyperconnected lives?

Child Mobile Phone ConnectedIn this survey, technology experts and stakeholders were fairly split in their opinions about whether highly connected people will end up having a positive or negative impact by 2020. The feeling is that young people who grow up hyper-connected via the internet, mobile web, and the internet will reap the benefit of being more nimble and quick-acting multitaskers. However on the other end, the same experts expect that those growing up fully connected will increase in their need for instant gratification, settling for quick choices, lacking patience, and the loss of social skills. Many expressed concerns of these trends, some mentioning George Orwell’s 1984 as well as fears of control by powerful interests in an age where distractions and quick entertainments rule.

Anyone remember this haunting quote?

” [it’s] easier [online] to be who you want to be, because nobody knows you and if you don’t like the situation you can just exit and it is over. ” – Clean Cut Media

[poll id=”24″]

Internet Connection helps with Learning & Multitasking!

The respondents were encouraged to pick one of two stances. 3% did not respond.

55% agreed with this statement:

In 2020 the brains of multitasking teens and young adults are “wired” differently from those over age 35 and overall it yields helpful results. They do not suffer notable cognitive shortcomings as they multitask and cycle quickly through personal and work related tasks. Rather, they are learning more and they are more adept at finding answers to deep questions, in part because they can search effectively and access collective intelligence via the internet. In sum, the changes in learning behavior and cognition among the young generally produce positive outcomes.

Internet Connection makes People Shallow & Lose Social Skills!

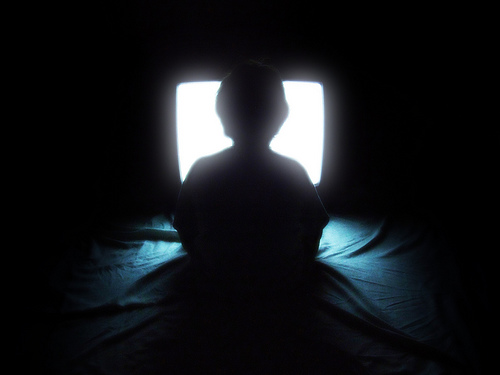
Child Watching TV Media - Hurts!42% agreed with the opposite statement:

In 2020, the brains of multitasking teens and young adults are “wired” differently from those over age 35 and overall it yields baleful results. They do not retain information; they spend most of their energy sharing short social messages, being entertained, and being distracted away from deep engagement with people and knowledge. They lack deep thinking capabilities; they lack face to face social skills; they depend in unhealthy ways on the internet and mobile devices to function. In sum, the changes in behavior and cognition among the young are generally negative outcomes.

What is considered Hyperconnected?

Hyperconnected basically means, you are always connected, a finger tip away. It is a word describing an environment where people are linked continuously through some kind of technology to other people and information.

Another survey from Pew Internet Projects show that 95% of teens ages 12-17 are online, 76% use social networking sites, and 77% have cell phones. Those in ages 18-29? 96% use the internet, 84% use social networking sites and 97% have cell phones. Over half of them use smartphones and 1 out of 4 own tablet computers like the iPad.

Want more Amazing Internet & Social Media Statistics?

[poll id=”7″]

So the same question remains.

  • Will Hyper-Connectedness of Millennials result in greater Benefit or Deteriment in the long run? Let us know your thoughts!
  • OR, at least think of a good caption for that litlte girl on the cell phone. Awesome picture!

Continue Reading

Top 10 Fastest Rising Google Searches in 2011

Google Releases Zeitgeist 2011 Search Statistics

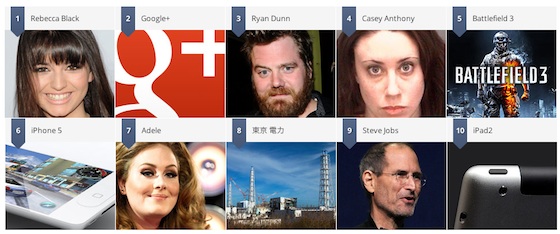
Google has released it’s Zeitgeist 2011 statistics. Google Zeitgeist highlights the top search trends of the year. I also see it as a snapshot into our culture because it really highlights recent fads, what sparks our interest and what grabbed the most attention. Whenever I see these lists, it’s a mix of excited curiosity and a bit of sadness over what grabs the most attention in our society. Take it as you will. Here is the top 10 list with some notes and comments for reference.

google zeitgeist search rankings 2011

Google Plus IconTop 10 Fastest Rising Google Searches in 2011

1.) Rebecca Black [WHY?!!]
2.) Google+
3.) Ryan Dunn [He was the main daredevil in the show jacka**. Died this year]
4.) Casey Anthony [Mother was found not guilty of first degree murder charges of her daughter Caylee]
5.) Battlefield 3 [Video Game]
6.) iPhone 5
7.) Adele [Singer]
8.) 東京 電力 (TEPCO) [Japan’s Nuclear Power Plant Evacuated after Quake.]
9.) Steve Jobs
10.) iPad 2

Considering all the tragedies that happened this year, you would think such things would be higher on the list, but Rebecca Black? Really?

Couple more top 5/10 lists for those interested.

Amazon Kindle FireTop 5 Google Searches – Gadgets

1.) Amazon Kindle Fire
2.) iPhone 4s
3.) Sidekick 4g
4.) HP Touchpad
5.) Spb Shell 3d
*6) iPad 2
[case you were wondering]

Top 10 Fastest Falling Google Searches in 2011

1.) Myspace [it has traffic to be falling?]
2.) Hi5 [oh I hate those spam friend emails!]
3.) Mebo
4.) Nasza Klasa
5.) Netlog
6.) Baidu
[Largest Search Engine in China.]
7.) Wer Kennt Wen
8.) Meinvz
9.) Hotmail Correo
10.) Delta Airlines

Top 5 Clean Cut Media Searches

Only because I know you are dying to know this…
I’ve also linked to the article driving the most traffic.
Note that these statistics favor postings that came earlier in the year since the data is cumulative.

In 2011 (search queries grouped by category).
1.) YouTube [YouTube Statistics – The Ultimate Time Suck]
2.) Chalk Art [3D Chalk Arts in the Streets Part I]
3.) Michael Jackson [Michael Jackson Death Causes Social Media Explosion]
4.) Social Media [Social Media Statistics Video]
5.) Clean Movies [Clean Family Friendly Movie Reviews & Ratings]
6.) 9/11 [Sept 11, 2001 – World Trade Center, Remembering 9/11]
7.) Art [Amazing 3D Building Chalk Arts]
8.) Photoshop [France to Regulate Airbrushed & Photoshopping Pictures]
9.) Facebook [Change Your New HTTPS Facebook Privacy Settings Now]
10.) Nickelback [Nickelback – Savin’ Me Music Video]

  • Any of this shock you or surprise you?
  • Any thoughts on this list?
Continue Reading

Black Friday & Cyber Monday Sales Hits New Records

Black Friday & Cyber Monday Sales Hit New Records

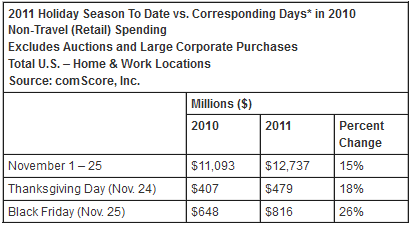
Online Shopping for Black Friday once again broke all previous records with sales of $816 million, up 26% compared to 2010. Even Thanksgiving Day (November 24th) which traditionally is a low sales day, saw a 18% increase in sales to $479 million.

Cyber Monday is estimated to have produced $1.25 billion dollars in sales (according to ComScore), up 22% from Cyber Monday 2010 which also was a record at the time. Last year we were stunned as Cyber Monday exceeded 1 Billion. However the sales continue to roll in. Other surveys conducted by IBM and eBay found even greater increases of 33% and 25% respectively. It’s final. Americans are spending more and more each year. Doesn’t matter if the economy is down, people will buy what they want.

Black Friday Sales Statistics at $816 Million

Black Friday Visits & Sales Statistics

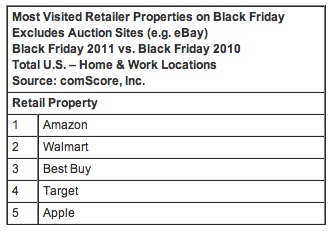
Amazon, Walmart, Best Buy, Target & Apple Leads the Way

Amazon, Walmart, Best Buy, Target, and Apple were the top 5 most visited retailer properties during Black Friday. 50 million Americans were out and about, visiting retail stores to search for the best Black Friday deals. These visitors accounted for a 35% increase in visits versus 2010.

Black Friday ComScore RetailA source from Apple Retail has shared that Apple’s forecast for Black Friday was 4X the normal sales levels. However, by 7PM, Apple had already blown past those forecasts fueled through big ticket items like the iPad and MacBook Air sales.

Other Black Friday Sales & Visit Statistics

  • Mobile devices accounted for 14.3% of all online Black Friday traffic, up 5.6% and responsible for 9.8% of online sales.
  • Ecommerce sales were up 59% compared to last year.
  • Black Friday mentions on Facebook & Twitter was up 110%.

Cyber Monday Sales Statistics – Tops $1.25 Billion!

On Cyber Monday, the average American consumer spent $198.26, up 2.6% from 2010. That’s nearly $200 dollars a person folks. More than 1 in 10 people used a mobile device to do research while about 6.6% of sales took place on the mobile device itself. This is 3X compared to 2010.

Mind Boggling Numbers: What do you think?

  • Any of these statistics surprise you? Disturb you?
  •  Were you able to find anything good on Black Friday or Cyber Monday?
Continue Reading

Black Friday 2011: What’s the Buzz (in Social Media) [Infographic]

Black Friday 2011Black Friday – Billion Dollar Business

In 2010, 212 million people spent around $45 billion dollars on Black Friday alone. As social media continues to grow and become mainstream, social media mediums such as Facebook and Twitter has become a huge source of buzz and announcements for Black Friday and Cyber Monday.

  • So what is the buzz on Black Friday?
  • What are people talking about?
  • Where are they headed?

Where are people planning to shop?

  • Walmart: 21%
  • Best Buy: 20%
  • Target: 13%
  • Macy: 11%
  • Amazon: 10%
  • Kmart: 9% (Kmart is still alive!?)
Black Friday 2011 Shopping
I'm so excited to buy stuff for myself!!!

Who will they buy it for?

  • Themselves: 46% (selfish!)
  • Others: 36% (aww…)
  • Both: 18% (feeling justified?)

What will they buy on Black Friday?

Computers / Tablets: 18% (iPads & Macbook Pro)
DVD / Music / Video: 17% (Playstation 3, Xbox 360, Call of Duty: MW3)
Shoes: 16% (Black Air Jordan Cements 3s, Black Air Yeezy 2)
Clothes: 14% (Polo Ralph Lauren, The Northface)
TVs: 12% (Flat Screen, 3D)
Cell Phones & Cameras: 9% (iPhone 4S, Galaxy Nexus, Evo 4G)

“In a recent study, 69% of shoppers stated that they trust the Internet for information on products and services (versus 43% who said magazines, and 35% who said TV). And 55% of shoppers say they’re less impulsive shoppers because of the Internet – they now take the time to research.”

Tablets: iPad vs Kindle Fire

10:1 – For every time Kindle Fire is mentioned on social media, iPad is mentioned 10 times the amount. As shoppers tend to discuss the brands and items they desire on social media, this is a trend that is noteworthy.

  • Anyone planning to get an iPad or Kindle Fire?

Black Friday Statistics Infographic!

Black Friday Twitter Infographic

  • What are you buying this Black Friday?
  • Do you end up buying something you need, or something you didn’t really need at all!
Continue Reading